
Choosing Water Purification Equipment Based on Specific Contaminant Removal Needs
The Critical Link Between Contaminant Profiles and Purification Success
Generic water systems crumble under the weight of complex contaminant matrices. A system designed for arsenic removal falters against chlorinated solvents, while PFAS slip through standard carbon filters like ghosts. Tailored solutions aren’t optional—they’re the difference between compliance and catastrophic failure.
")
Why One-Size-Fits-All Systems Fail in Complex Scenarios
Activated carbon traps benzene but ignores nitrates. Reverse osmosis (RO) membranes reject 95% of sodium yet permit chloroform diffusion. Each contaminant family demands bespoke strategies—overlooking this reality risks regulatory rebukes and public health liabilities.
How Contaminant-Specific Design Impacts Regulatory Compliance
EPA’s MCLs for lead (0.015 ppm) require different tech than WHO’s 1.3 ppm PAH limits. Systems claiming NSF/ANSI 53 certification for cysts must reprove efficacy against emerging threats like PFOS. Compliance isn’t static—it evolves with contaminant discoveries.
Understanding Water Contaminant Classifications: A Scientific Framework
Particulates >1 µm surrender to pleated filters, while dissolved ions demand ion-selective warfare. Emerging threats like PFOA (0.7 nm diameter) defy conventional categorization, demanding hybridized approaches.
Particulate vs. Dissolved Contaminants: Removal Challenges
10-µm sediment particles bow to depth filters, but dissolved hexavalent chromium requires redox filtration. Colloidal silica (0.02 µm) straddles both worlds, necessitating zeta potential manipulation for effective coagulation.
Emerging Threats: Pharmaceuticals, Microplastics, and PFAS
17α-ethinylestradiol (EE2) resists biodegradation, demanding UV/H2O2 advanced oxidation. Microplastics<0.1 µm require ultrafiltration membranes with 50 kDa cutoffs. PFAS’s carbon-fluorine bonds (485 kJ/mol) laugh at conventional treatments.
Conducting a Comprehensive Water Quality Analysis
Total coliform tests miss norovirus. TDS meters ignore nonionic pesticides. True analysis employs LC-MS/MS for PPCPs and TOX scanners for halogenated DBPs. The devil—and the solution—lies in the details.
Interpreting Laboratory Reports: Beyond Basic TDS and pH Testing
Elevated sulfate (>250 ppm) accelerates anion resin exhaustion. Manganese at 0.05 ppm oxidizes to MnO2, fouling membranes. Learn to read between the lines—secondary contaminants dictate treatment longevity.
Identifying Secondary Contaminants That Impact Taste and Odor
Geosmin (10 ng/L threshold) survives chlorination, requiring ozone or GAC contactors. Hydrogen sulfide’s rotten egg stench demands catalytic carbon impregnated with KMnO4. Aesthetic issues often signal deeper chemical imbalances.
Biological Contaminants: Targeting Pathogens and Biofilms
Cryptosporidium’s 3-5 µm oocysts bypass standard filters—only absolute 1-µm barriers or UV dose >12 mJ/cm² guarantee safety. Biofilms shelter pathogens in EPS matrices, necessitating intermittent chloramine shocks.
Bacteria, Viruses, and Protozoa: Matching Technologies to Microbial Sizes
RO removes 99.99% of poliovirus (28 nm), but MS2 bacteriophage (27 nm) requires 4-log UV inactivation. Giardia’s 8-12 µm cysts succumb to bag filters, while 0.3 µm Mycobacterium needs ceramic candle filters.
UV vs. Chlorination: Balancing Efficacy and Byproduct Risks
254-nm UV achieves 4-log virus reduction but leaves no residual protection. Chlorination forms THMs; chloramination minimizes DBPs but struggles against nitrosamine precursors. The choice hinges on pathogen load vs. chemical risk tolerance.
Chemical Contaminants: From Heavy Metals to Industrial Solvents
Lead(II) ions bind strongly to phosphate-doped activated alumina. Chromium(VI) demands reduction to Cr(III) before precipitation. Each metal dances to a different chemical tune—play the right accompaniment.
Lead and Arsenic Removal: Activated Alumina vs. Ion Exchange
Activated alumina adsorbs arsenate (AsV) at pH 5.5 but ignores arsenite (AsIII)—pre-oxidation with KMnO4 is essential. Lead-specific resins (like PbSorb™) achieve<1 ppb residuals, outperforming generic cation exchangers.
Volatile Organic Compounds (VOCs): Activated Carbon Strategies
Macroporous carbon (20-50 Å pores) traps MTBE, while microporous variants (<10 Å) target TCE. Empty Bed Contact Time (EBCT) below 2 minutes slashes removal efficiency by 60%—size matters, but dwell time matters more.
Inorganic Contaminants: Addressing Hardness and Nitrate Pollution
RO rejects 94% of nitrates but wastes 40% water. Electrodialysis reversal (EDR) achieves 85% nitrate removal at half the brine. For hardness, nanofiltration (200-400 Da) preserves beneficial Ca²⁺ while removing Na⁺.
Reverse Osmosis for Nitrate and Fluoride Removal
Thin-film composite RO membranes achieve 92% fluoride rejection at 200 psi. However, nitrate’s lower hydration radius (0.3 nm vs. F⁻’s 0.35 nm) challenges standard membranes—nitrate-specific TFC variants improve rejection to 88%.
Nanofiltration Systems for Selective Mineral Retention
NF270 membranes remove 98% of Mg²⁺ while passing 30% of K⁺—ideal for agricultural blends. Charge-based exclusion preserves nitrate for fertigation but blocks sulfates causing osmotic stress.
Particulate Matter: Solving Turbidity and Sediment Issues
Sub-micron particles (0.1-1 µm) slip through sand filters but get trapped in melt-blown polypropylene depth filters. Zeta potential modification (-30 mV to +5 mV) via Al³⁺ dosing aggregates colloids for easier capture.
Depth Filtration vs. Membrane Barriers for Sub-Micron Particles
Depth filters load 10 g/ft³ before blinding; 0.45 µm membranes clog irreversibly at 0.3 psi ΔP. For 0.1-µm viruses, electronegative microglass fibers adsorb via London forces—no pore size needed.
The Role of Zeta Potential in Colloidal Contaminant Aggregation
At zeta potentials >|25| mV, colloids repel; adding FeCl3 at pH 6 neutralizes charge. Flocculation accelerators like polyDADMAC then grow flocs to 50 µm—filterable by 10-µm cartridge filters.
Pharmaceuticals and Endocrine Disruptors: Modern Water Challenges
17β-estradiol (E2) resists biodegradation but fractures under 254 nm UV + 5 ppm H2O2. Powdered activated carbon (PAC) doses at 20 mg/L remove 80% of diclofenac—if contact time exceeds 15 minutes.
Advanced Oxidation Processes (AOPs) for Hormone Degradation
UV/TiO2 systems generate hydroxyl radicals (•OH) that cleave EE2’s ethinyl group. Ozone/peroxide blends attack bisphenol A’s phenolic rings. Each AOP configuration destroys 3.5 logs of contaminants but escalates OPEX by 30%.
PAC vs. GAC: Adsorption Efficiency for Low-Concentration Organics
PAC’s 1500 m²/g surface area outperforms GAC’s 1000 m²/g for trace (<10 ppb) contaminants. But GAC’s 4 mm pellets enable 5-minute EBCT vs. PAC’s 30-second contact—a trade-off between efficiency and practicality.
PFAS and Forever Chemicals: Cutting-Edge Removal Solutions
Single-use anion resins (e.g., Purolite® PFA694E) achieve 99.9% PFOS removal but require incineration post-use. High-pressure RO (800 psi) tackles short-chain PFBA but consumes 3x energy of standard systems.
Ion Exchange Resins vs. High-Pressure Membrane Systems
Resins excel in low-PFAS scenarios (
Thermal Destruction Technologies for PFAS Mineralization
Supercritical water oxidation (SCWO) at 374°C/221 bar decomposes PFAS into CO2 and HF. Plasma torches (10,000°C) atomize carbon-fluorine bonds. Both methods achieve >99.99% destruction but demand expert operation.
Radiological Contaminants: Uranium, Radon, and Beyond
Mixed-bed DI resins reduce uranium-238 to
Mixed-Bed Deionization for Radioactive Isotope Removal
Strong acid cation resins trap Ra-226; strong base anion resins grab I-131. Regeneration with 10% HCl/H2SO4 elutes isotopes into secure waste streams. Cross-contamination risks demand separate resin columns for alpha/beta emitters.
Aeration Systems for Gaseous Radon Mitigation
Packed tower aeration achieves 95% Rn-222 removal with 20-foot tower heights. Diffused bubble systems in sealed tanks strip radon via Henry’s law, venting decay products through HEPA filters. Air-to-water ratios below 5:1 risk incomplete stripping.
Matching Technologies to Contaminant Molecular Weights
Ultrafiltration’s 10 kDa cutoff blocks proteins but passes sucrose. RO’s 100 Da barrier rejects NaCl (58 Da) but allows methanol (32 Da). Molecular weight alone doesn’t dictate removal—charge and polarity play equal roles.
Molecular Cut-Off Thresholds in Ultrafiltration and Reverse Osmosis
UF’s 50 kDa membranes retain endotoxins (10-20 kDa) but pass antibiotics like penicillin (334 Da). RO’s polyamide layers exclude hydrated ions (Na⁺·3H2O = 101 Da) via size exclusion and charge repulsion.
The Significance of Dalton Ratings in Membrane Selection
300 Da nanofiltration membranes remove 90% of atrazine (215 Da) via adsorption, not size exclusion. Dalton ratings indicate approximate cutoffs, but real-world performance hinges on solute-membrane interactions.
Hybrid Systems: Layered Approaches for Multi-Contaminant Water
Electrocoagulation (20 A/m²) destabilizes arsenic-colloid complexes before RO polishing. UV-AOP followed by GAC removes pathogens and destroys DBPs in one train. Hybridization conquers contaminant cocktails.
Sequential Treatment Trains for Agricultural Runoff Challenges
First stage: lime softening for Ca²⁺/Mg²⁺. Second: biological denitrification. Third: ozonation for pesticides. Fourth: GAC for residual organics. Each step addresses specific agrochemical threats.
Integrating Electrocoagulation with Membrane Filtration
Aluminum electrodes generate Al(OH)3 flocs that adsorb arsenic and entrap bacteria. Subsequent UF membranes capture flocs while allowing clean permeate. The combo slashes chemical usage by 70% versus conventional coagulation.
Point-of-Use vs. Point-of-Entry Systems: Application-Based Design
Under-sink RO units (0.5 GPM) protect drinking taps from Pb²⁺. Whole-house carbon filters (10 GPM) shield all water uses from VOCs. Match scale to risk—spot protection vs. comprehensive defense.
Under-Sink Reverse Osmosis for Targeted Heavy Metal Removal
Compact RO systems with lead-specific post-filters achieve<1 ppb Pb at kitchen taps. Permeate pumps boost recovery rates to 40%, reducing wastewater—a must for urban installations with sewer fees.
Whole-House Activated Carbon for VOC Protection
20-inch big blue carbon filters (1.5 cu ft) treat 10 GPM with 6-month replacement cycles. Catalytic carbon beds remove chloramines that standard GAC misses, protecting entire households from THM exposure.
Flow Rate Requirements: Scaling Systems to Contaminant Loads
Empty Bed Contact Time (EBCT) below 2 minutes cripples VOC removal. For 100 gpm flows, 8-foot carbon towers (EBCT=4 min) require 32 ft³ media. Undersizing guarantees failure; oversizing wastes capital.
Calculating Empty Bed Contact Time (EBCT) for Carbon Filters
EBCT (min) = (Carbon volume (ft³) × 7.48) / Flow (gpm). For 90% TCE removal at 20 gpm: 10 ft³ carbon × 7.48 / 20 = 3.74 min EBCT. Below 3 min? Expect breakthrough in 3 months.
Peak Demand Considerations in Municipal vs. Industrial Systems
Municipal RO plants need 30% excess capacity for fire flows. Pharmaceutical facilities require 24/7 consistency—twin RO trains with automatic switchovers prevent production halts during membrane cleans.
Regulatory Standards: Aligning Equipment with EPA and WHO Guidelines
NSF/ANSI 53-certified systems guarantee VOC reduction to EPA MCLs. EU Directive 2020/2184 mandates<0.5 µg/L for PFAS—achievable only with anion exchange + RO. Compliance isn’t a checkbox; it’s a moving target.
NSF/ANSI Standards for Specific Contaminant Reduction Claims
NSF/ANSI 58 certifies RO systems for TDS reduction; NSF/ANSI 62 covers UV disinfection. For PFAS, NSF 489 provides third-party validation—critical for municipalities facing litigation over “forever chemicals.”
EU Drinking Water Directive Compliance for Cross-Border Operations
EU’s parametric value for uranium (0.03 mg/L) demands mixed-bed DI after RO. Bromate limits (0.01 mg/L) require ozone-free AOPs. Multinational companies must navigate a labyrinth of regional standards.
Cost-Benefit Analysis of Contaminant-Specific Technologies
RO membranes cost $0.10/gallon over 5 years; distillation hits $0.25/gallon. Activated carbon needs $1,200/year replacements for VOC control—cheaper than $50k in EPA fines for non-compliance.
RO Membrane Lifespan vs. Distillation Energy Costs
Thin-film RO elements last 5 years at $300 replacement cost. Distillation’s 1.2 kW-hr/gallon energy draw costs $900 annually for 10 GPD systems. Membrane tech wins except in high-TDS (>2000 ppm) scenarios.
Activated Carbon Replacement Frequency vs. Initial System Investment
Cheap $500 carbon tanks require quarterly $200 media changes. Premium systems with backwashable GAC last 5 years at $5k upfront. The break-even point? 6.25 years—choose based on operational horizons.
Case Studies: Real-World Contaminant Removal Success Stories
Bangladesh’s 20,000 community arsenic plants (SONO filters) cut poisoning rates by 90%. Massachusetts’ PFAS remediation combined anion exchange with on-site plasma destruction—a model for industrial hotspots.
Arsenic Crisis Solutions in Bangladesh: Community-Scale Systems
Iron hydroxide-coated sand filters adsorb As(III) without electricity. Monthly maintenance by local workers sustains 95% compliance—a triumph of appropriate technology over complex infrastructure.
PFAS Remediation in Industrial Zones: Lessons from the U.S. EPA
EPA’s pilot in Michigan combined anion exchange resin (for long-chain PFAS) with RO (short-chain). Brine concentrates underwent supercritical water oxidation, achieving 99.997% destruction—a template for industrial sites.
Future-Proofing Against Emerging Contaminants
Modular skids allow swift tech swaps when new threats emerge. AI algorithms trained on 10,000 contaminant profiles predict treatment gaps before regulators act. Stay reactive, and you’ll drown in catch-up costs.
Adaptable Systems for Unknown Contaminant Threats
Skid-mounted UV-AOP + RO + GAC systems can reorder treatment stages as needed. Quick-connect fittings permit adding boron-specific resin columns when new MCLs drop—flexibility is insurance.
AI-Driven Monitoring for Dynamic Contaminant Response
Machine learning models analyzing real-time TOC, conductivity, and ORP data predict membrane fouling 48 hours early. Neural nets correlating weather patterns with agricultural runoff optimize pretreatment dosing.
Maintenance Considerations for Targeted Contaminant Removal
Regenerating ion exchange resins with 10% NaCl risks calcium sulfate scaling—acid washes pre-regeneration prevent fouling. Biofilms on organic-targeting systems require monthly citric acid flushes.
Regenerating Ion Exchange Resins Without Cross-Contamination
Counter-current regeneration with 5% HCl for cation resins, 4% NaOH for anions. Separate waste streams prevent Cr(VI) from contaminating As(V) regeneration cycles—cross-contamination invites compliance nightmares.
Biofouling Prevention in Systems Targeting Organic Contaminants
Weekly 2 ppm chloramine pulses suppress biofilm growth without damaging RO membranes. For chloramine-sensitive systems, monthly 1% hydrogen peroxide flushes achieve 3-log bioburden reduction.
Expert Insights: Engineers Share Contaminant-Specific Design Secrets
“Chloramines demand catalytic carbon—standard GAC just buys time,” warns Dr. Helen Zhou. John MacReady adds, “Pre-oxidizing Fe²⁺ to Fe³⁺ before filtration prevents manganese greensand media fouling.”
“Why Activated Carbon Alone Fails Against Chloramines” – Water Chemist
“Chloramines’ neutral charge bypasses carbon’s adsorption sites. Catalytic media with Cu-Zn oxides break NH2Cl into NH4+ and Cl−, which then bind to ion exchange sites. It’s a two-stage knockout.”
“The Overlooked Role of Pre-Oxidation in Iron Removal” – Treatment Plant Manager
“Injecting KMnO4 before greensand filters converts soluble Fe²⁺ to Fe(OH)3 particulates. Without oxidation, iron slips through and plates distribution pipes—a $100k corrosion bill waiting to happen.”
Checklist for Contaminant-Focused System Selection
- Conduct contaminant prioritization via EPA’s Risk-Screening Matrix
- Verify NSF certifications match target contaminants
- Calculate 10-year lifecycle costs (CAPEX + OPEX)
- Validate performance via third-party labs like UL or WQA
Compliance Documentation Requirements
Maintain 10-year records of membrane autopsies, resin regeneration logs, and microbial tests. Digital logbooks with blockchain timestamps satisfy FDA 21 CFR Part 11 and EU Annex 11 requirements.
FAQ: Navigating Complex Contaminant Removal Queries
“Can Reverse Osmosis Remove 100% of Microplastics?”
RO achieves >99.99% removal of particles >0.001 µm, including most microplastics. However, nanoplastics (<0.1 µm) may require ultrafiltration pretreatment.
“What System Removes Both Fluoride and Pesticides Cost-Effectively?”
RO + post-carbon systems tackle fluoride via rejection and pesticides via adsorption. Total cost: $1,200-$2,500 for residential systems; $0.08/gallon operational.
“How Often Should VOC-Focused Carbon Filters Be Replaced?”
Replace when EBCT drops below design specs—typically 6-12 months for residential, 3-6 months for industrial. Monitor via breakthrough testing with PID detectors.
Must-Read Blogs For Chain Restaurants Owner
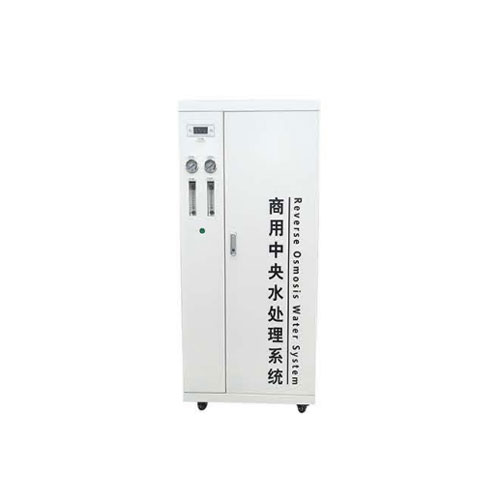 YL-W-06 Commercial Water Purification Equipment
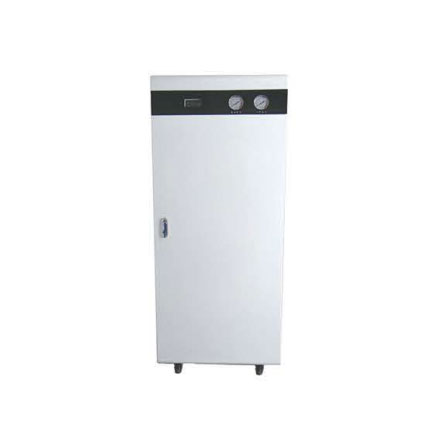 YL-W-05 Commercial Water Purification Equipment
 YL-W-04 Commercial Water Purification Equipment
 YL-W-03 Commercial Water Purification Equipment
Ready to Get Started?